
Long Term Storage of Github Repo Traffic Metrics for Analytics with Databricks
27 Nov 2022TLDR; Github currently stores traffic metrics for only 15 days - if you want to store these metrics for a longer period you are out of luck. I wanted to have these numbers for my own repos, so in this post I will show how I have done that using Databricks, Delta, Workflows, and Databricks SQL.
Github Traffic Metrics
For any particular code repo, Github provides a really nice feature under the Insights tab, which indicates some analytics metrics such as number of visits and repo clones.
I have recently released Jupyter to Databricks, a simple Github Action which automatically converts all the Jupyter Notebooks from a given path in your repo to Databricks Python Notebooks. I wanted to gauge how many people were interested by it, so I looked over the metrics for the repo where I’m storing the code for this Github action (this one). This is what I found:
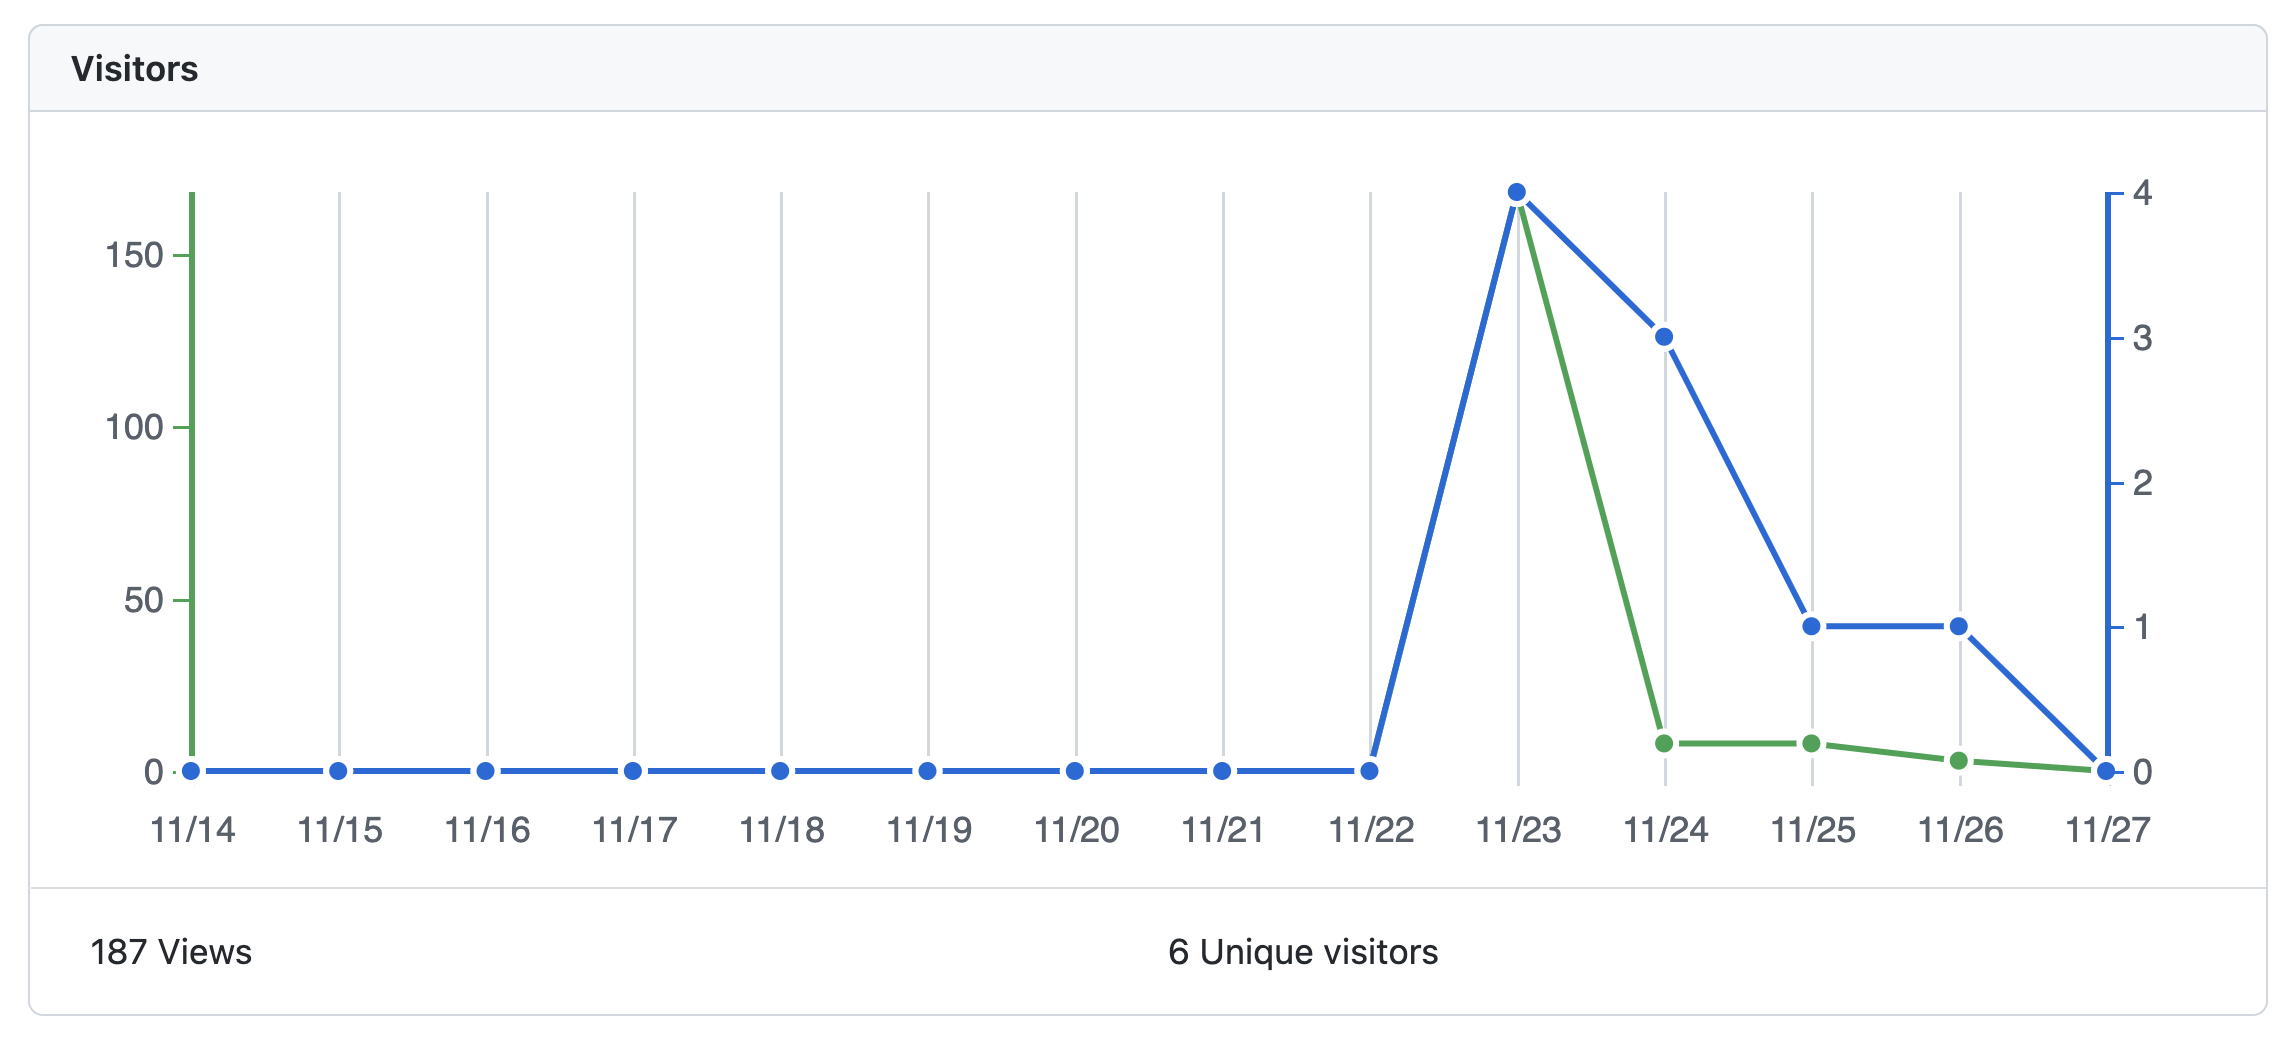
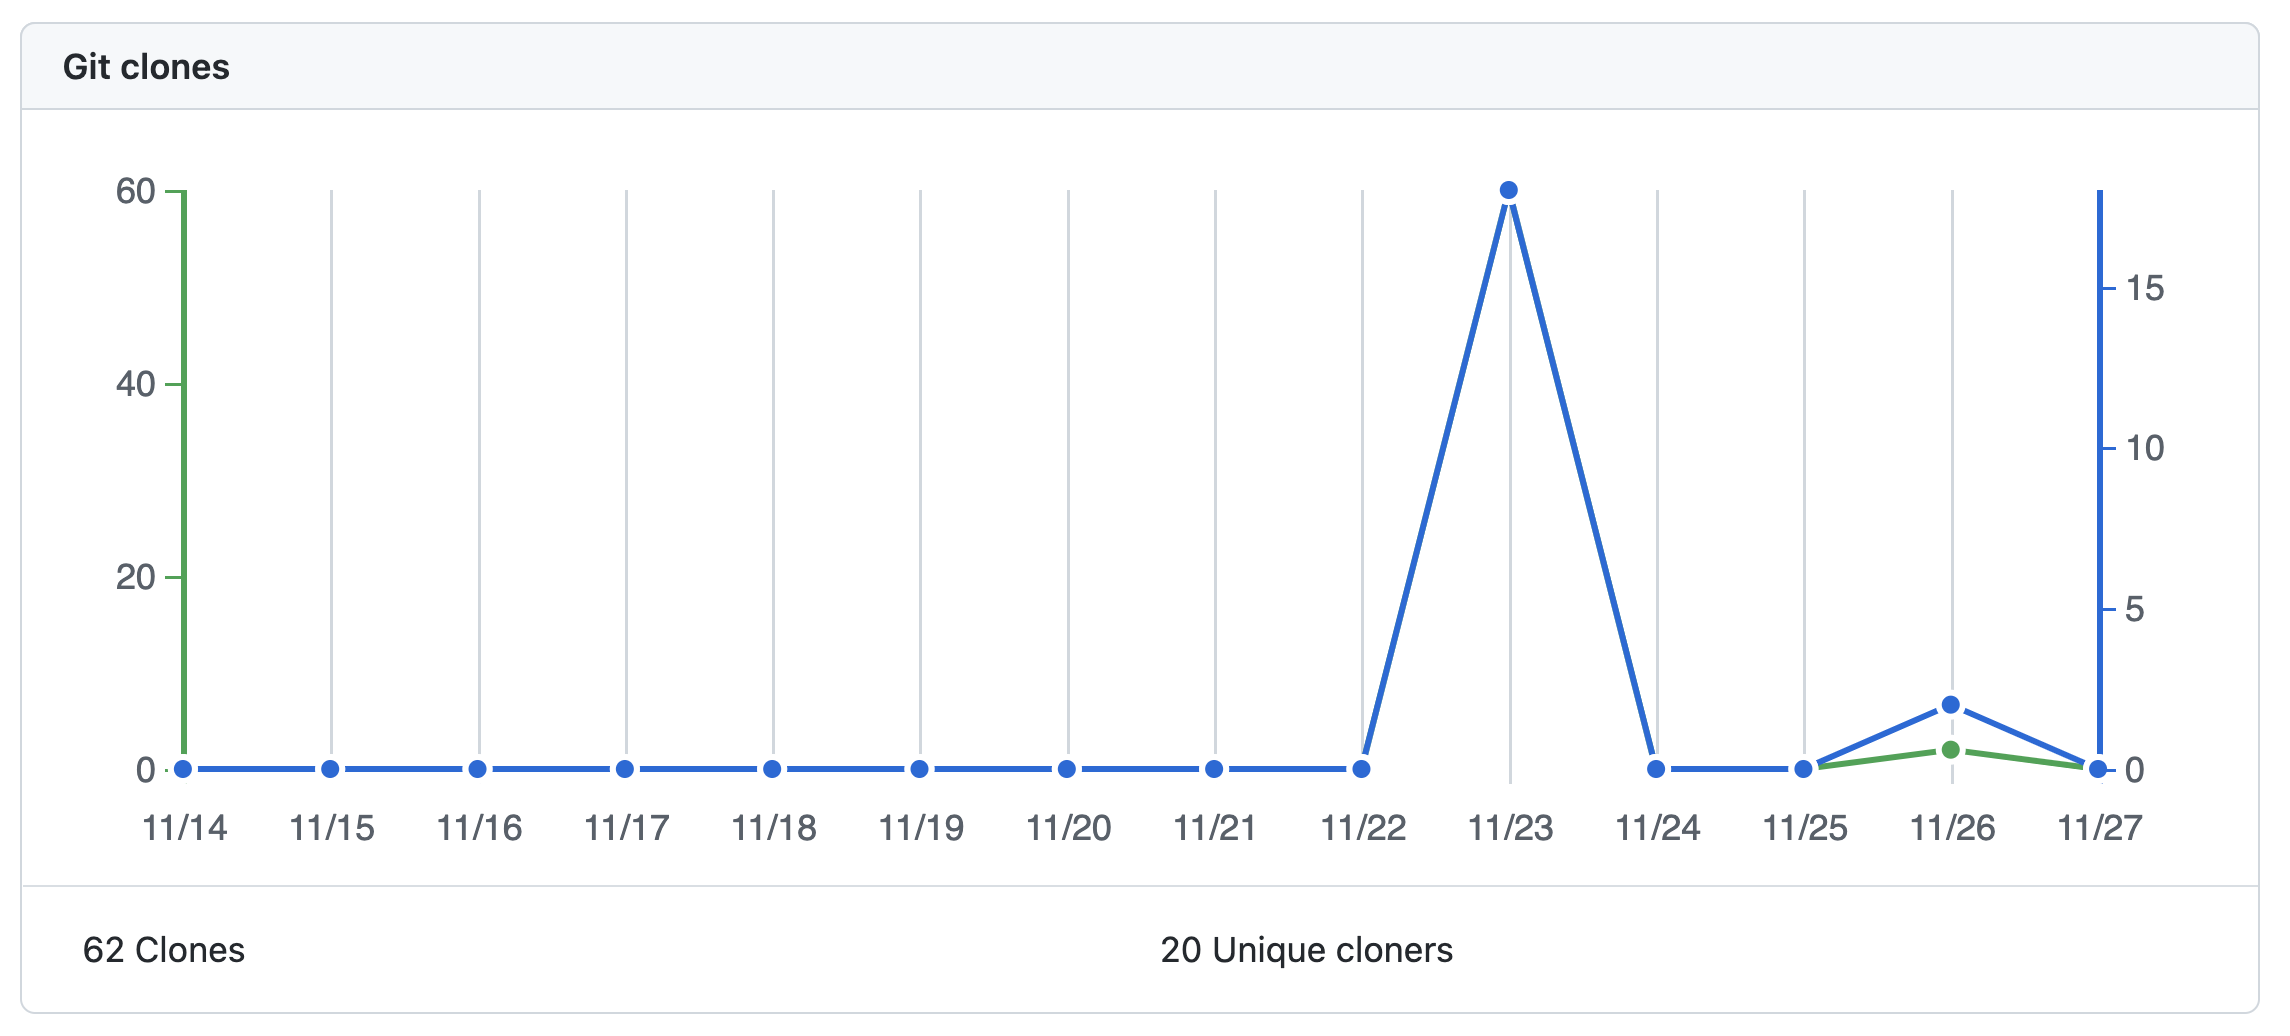
This is pretty neat. There’s only one issue: these are only stored for 15 days, meaning you lose everything that is older than that.
Retrieving and Storing these Metrics
Luckily, there’s a Python package that allows to easily interact with Github’s REST API: PyGithub. Most of the API endpoints are exposed in this package, and for repo statistics this is no different.
With PyGithub on my side, I just needed to schedule a process to run it and store the resulting metrics somewhere. I didn’t want to store these in a transactional database - didn’t want to bother setting up one just for the sake of this amount of data. On the other hand, if I stored this in simple cloud storage the cost would be negligible, so I thought, why not storing this in Delta?
So I coded up the following notebook to:
- Authenticate with Github using a PAT Token that I generated
- Iterate through all of the repos in my account and fetch traffic metrics & statistics
- Store these metrics as two separate Delta tables:
viewsandclones- I admit I was lazy to code up aMERGEstatement to only insert new / non-overlapping records, but ended up just creating a separate,goldentable after removing the duplicates from therawtable 😃
# Databricks notebook source
!pip install --upgrade pip && pip install pygithub

# COMMAND ----------

ACCESS_TOKEN = dbutils.secrets.get(scope = "github", key = "github-access-token")

# COMMAND ----------

from github import Github
import os
from pyspark.sql import SparkSession, Row
from pyspark.sql.types import (
    StructType,
    StructField,
    TimestampType,
    IntegerType,
    StringType
)

def get_repos_traffic():
    # using an access token
    g = Github(ACCESS_TOKEN)

    user = g.get_user(login="rafaelvp-db")
    repos = user.get_repos()
    views_list = []
    clones_list = []

    for repo in repos:
        print(repo.name)
        views = repo.get_views_traffic(per = "day")
        clones = repo.get_clones_traffic(per = "day")
        list_views = [
            {
                "repo": repo.name,
                "uniques": view.uniques,
                "count": view.count,
                "timestamp": view.timestamp
            }
            for view in views["views"]
        ]

        list_clones = [
            {
                "repo": repo.name,
                "uniques": clone.uniques,
                "count": clone.count,
                "timestamp": clone.timestamp
            }
            for clone in clones["clones"]
        ]
        views_list.extend(list_views)
        clones_list.extend(list_clones)

    schema = StructType([
        StructField("repo", StringType(), False),
        StructField("uniques", IntegerType(), False),
        StructField("count", IntegerType(), False),
        StructField("timestamp", TimestampType(), False),
    ])
    spark = SparkSession.builder.getOrCreate()
    df_views = spark.createDataFrame(views_list, schema = schema)
    df_clones = spark.createDataFrame(clones_list, schema = schema)
    df_views.write.saveAsTable("views", mode = "append")
    df_clones.write.saveAsTable("clones", mode = "append")

# COMMAND ----------

get_repos_traffic()

# COMMAND ----------

spark.sql("select * from views").dropDuplicates(["repo", "timestamp"]).write.saveAsTable("views_golden", mode = "overwrite")
spark.sql("select * from clones").dropDuplicates(["repo", "timestamp"]).write.saveAsTable("clones_golden", mode = "overwrite")
Orchestration
In the past, I would simply setup a VM with a cron task to run this code, or even use an existing Airflow installation and setup a DAG to run this on a schedule.
Since I wanted to simplify my life here by avoiding any kind of work related to infra setup, I went with Databricks Workflows. The workflow itself was really simple to setup, and it looks like this:
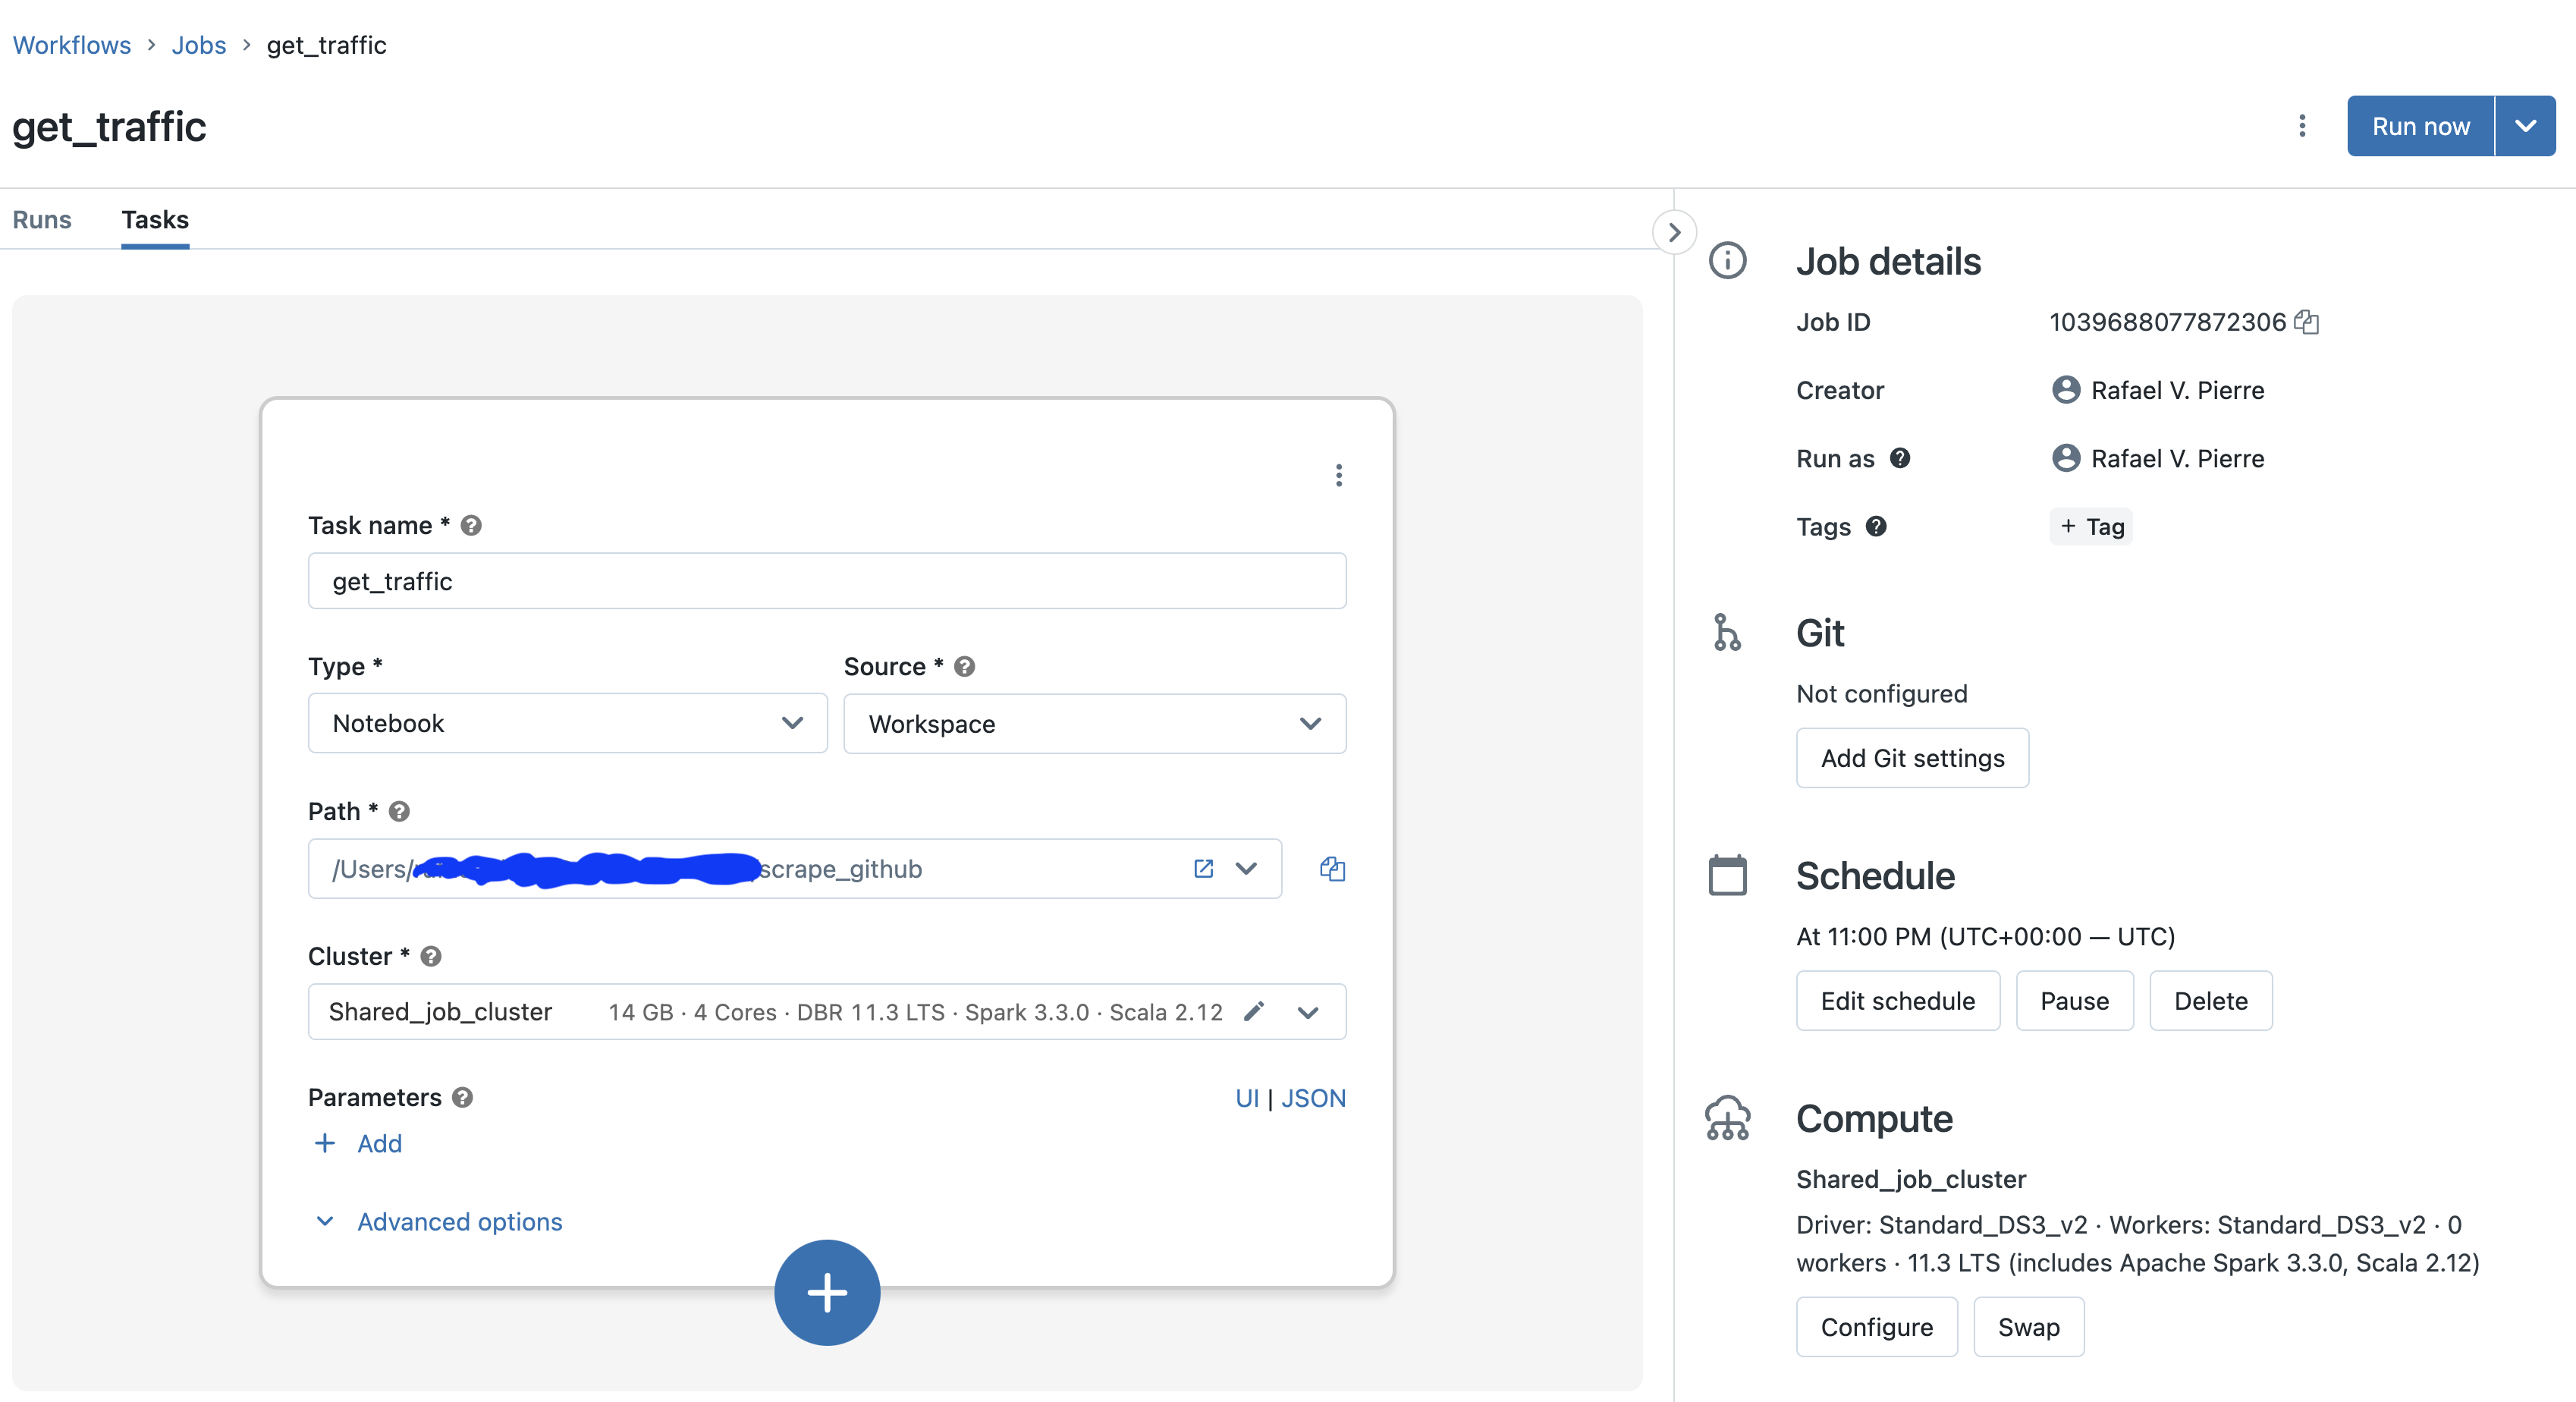
I’m using a really small, single node job cluster - this means that I’m spinning up compute with insignificant amount of cost on the fly; once the job stops running, cluster is automatically killed. 💰
Visualization & Analytics
All right, now that I had the data, time to create some nice & insightful visualizations.
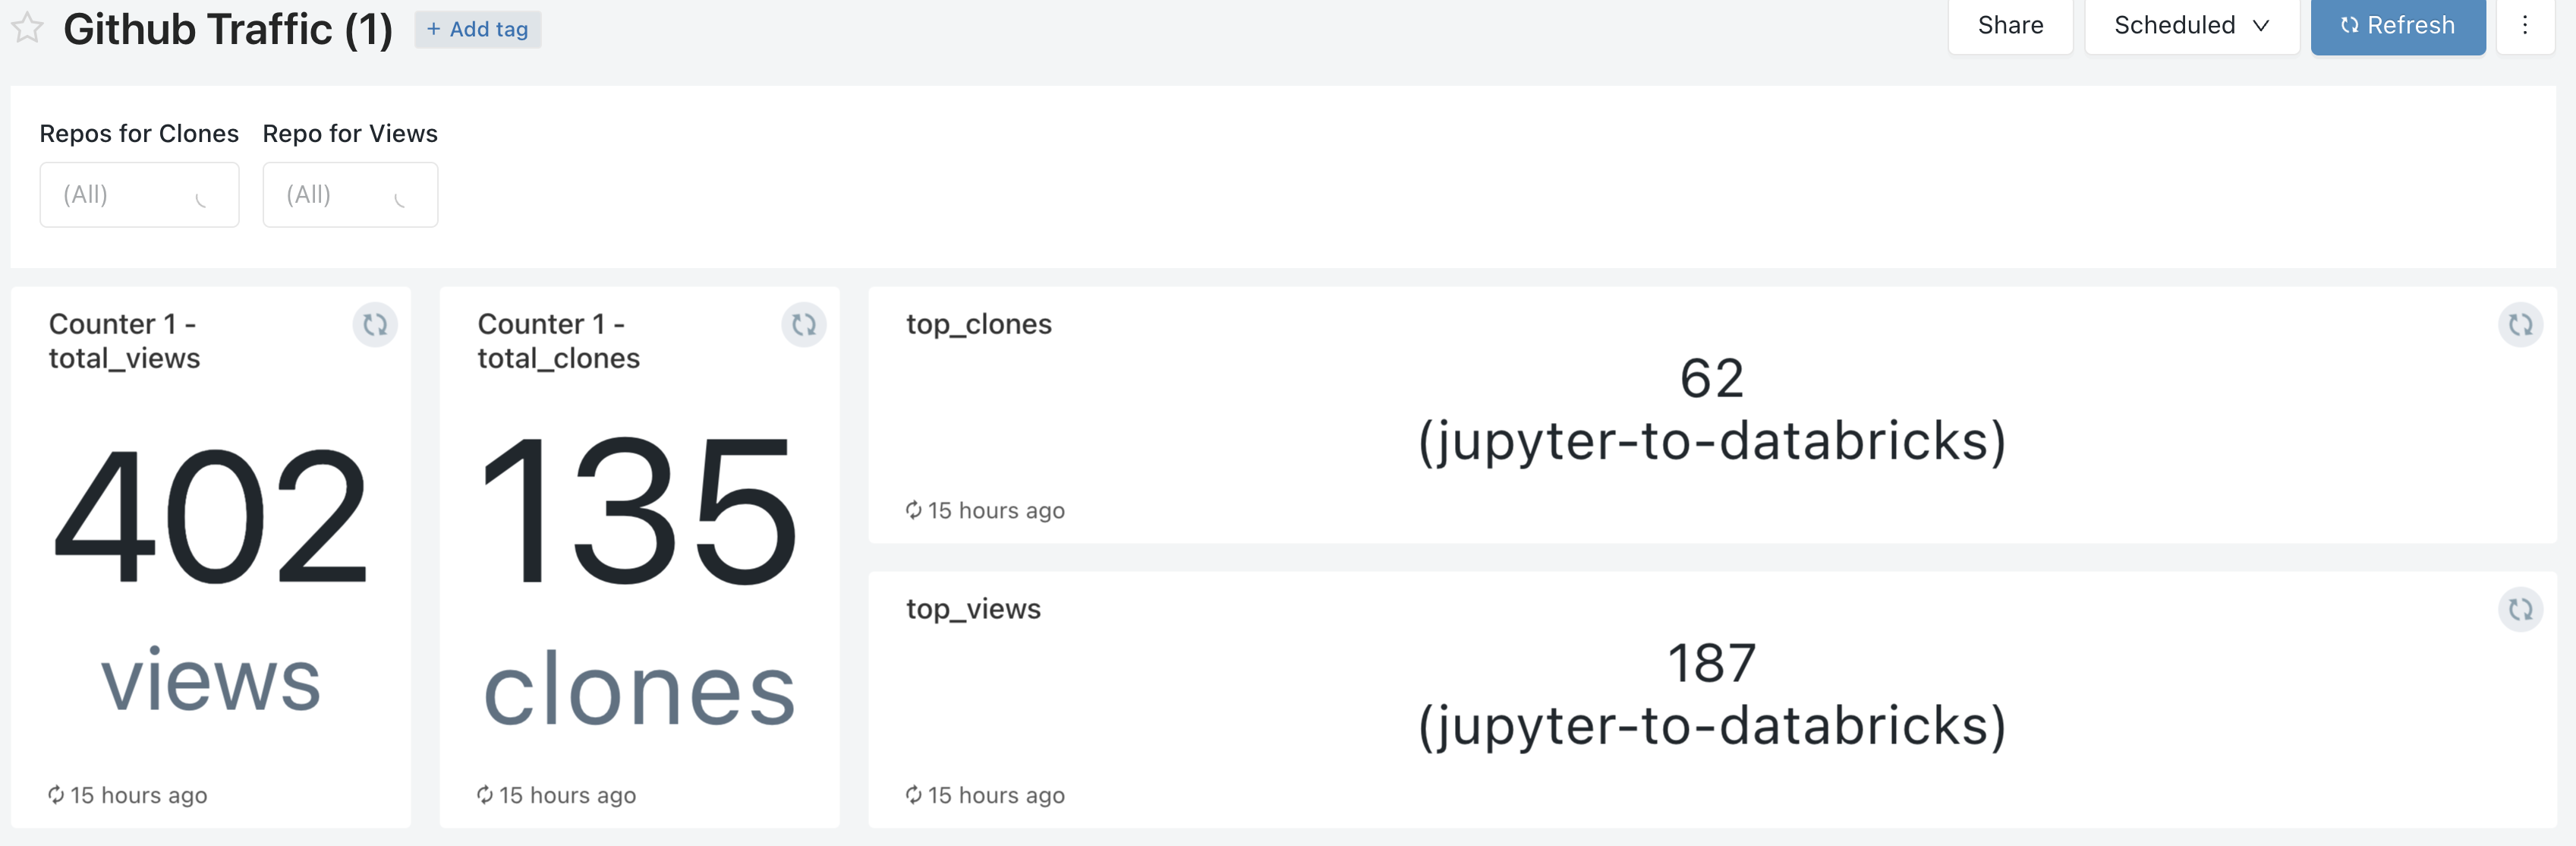
I had everything running under Databricks. So I thought, why not keep it simple and also do the analytics part with Databricks SQL?
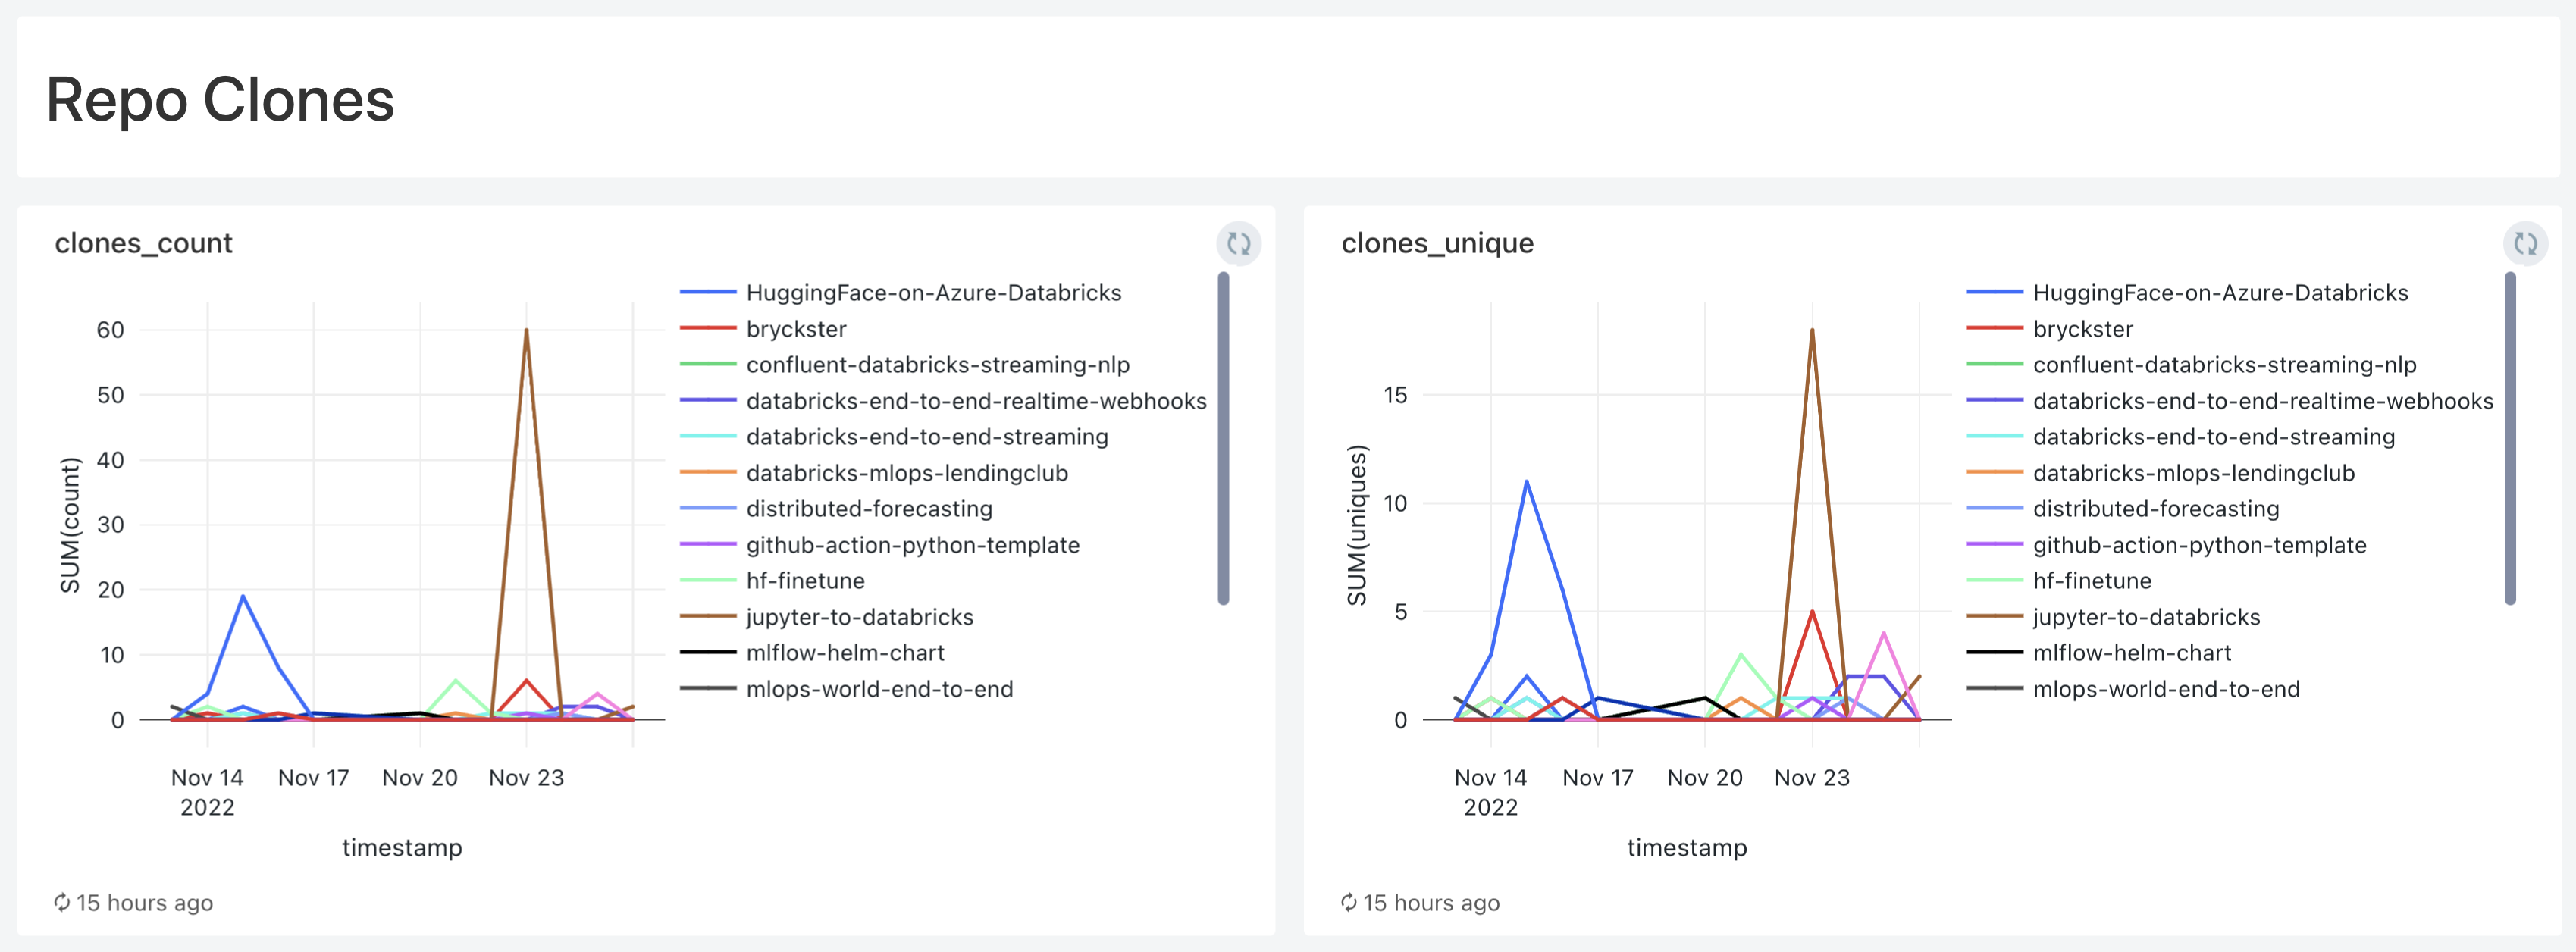
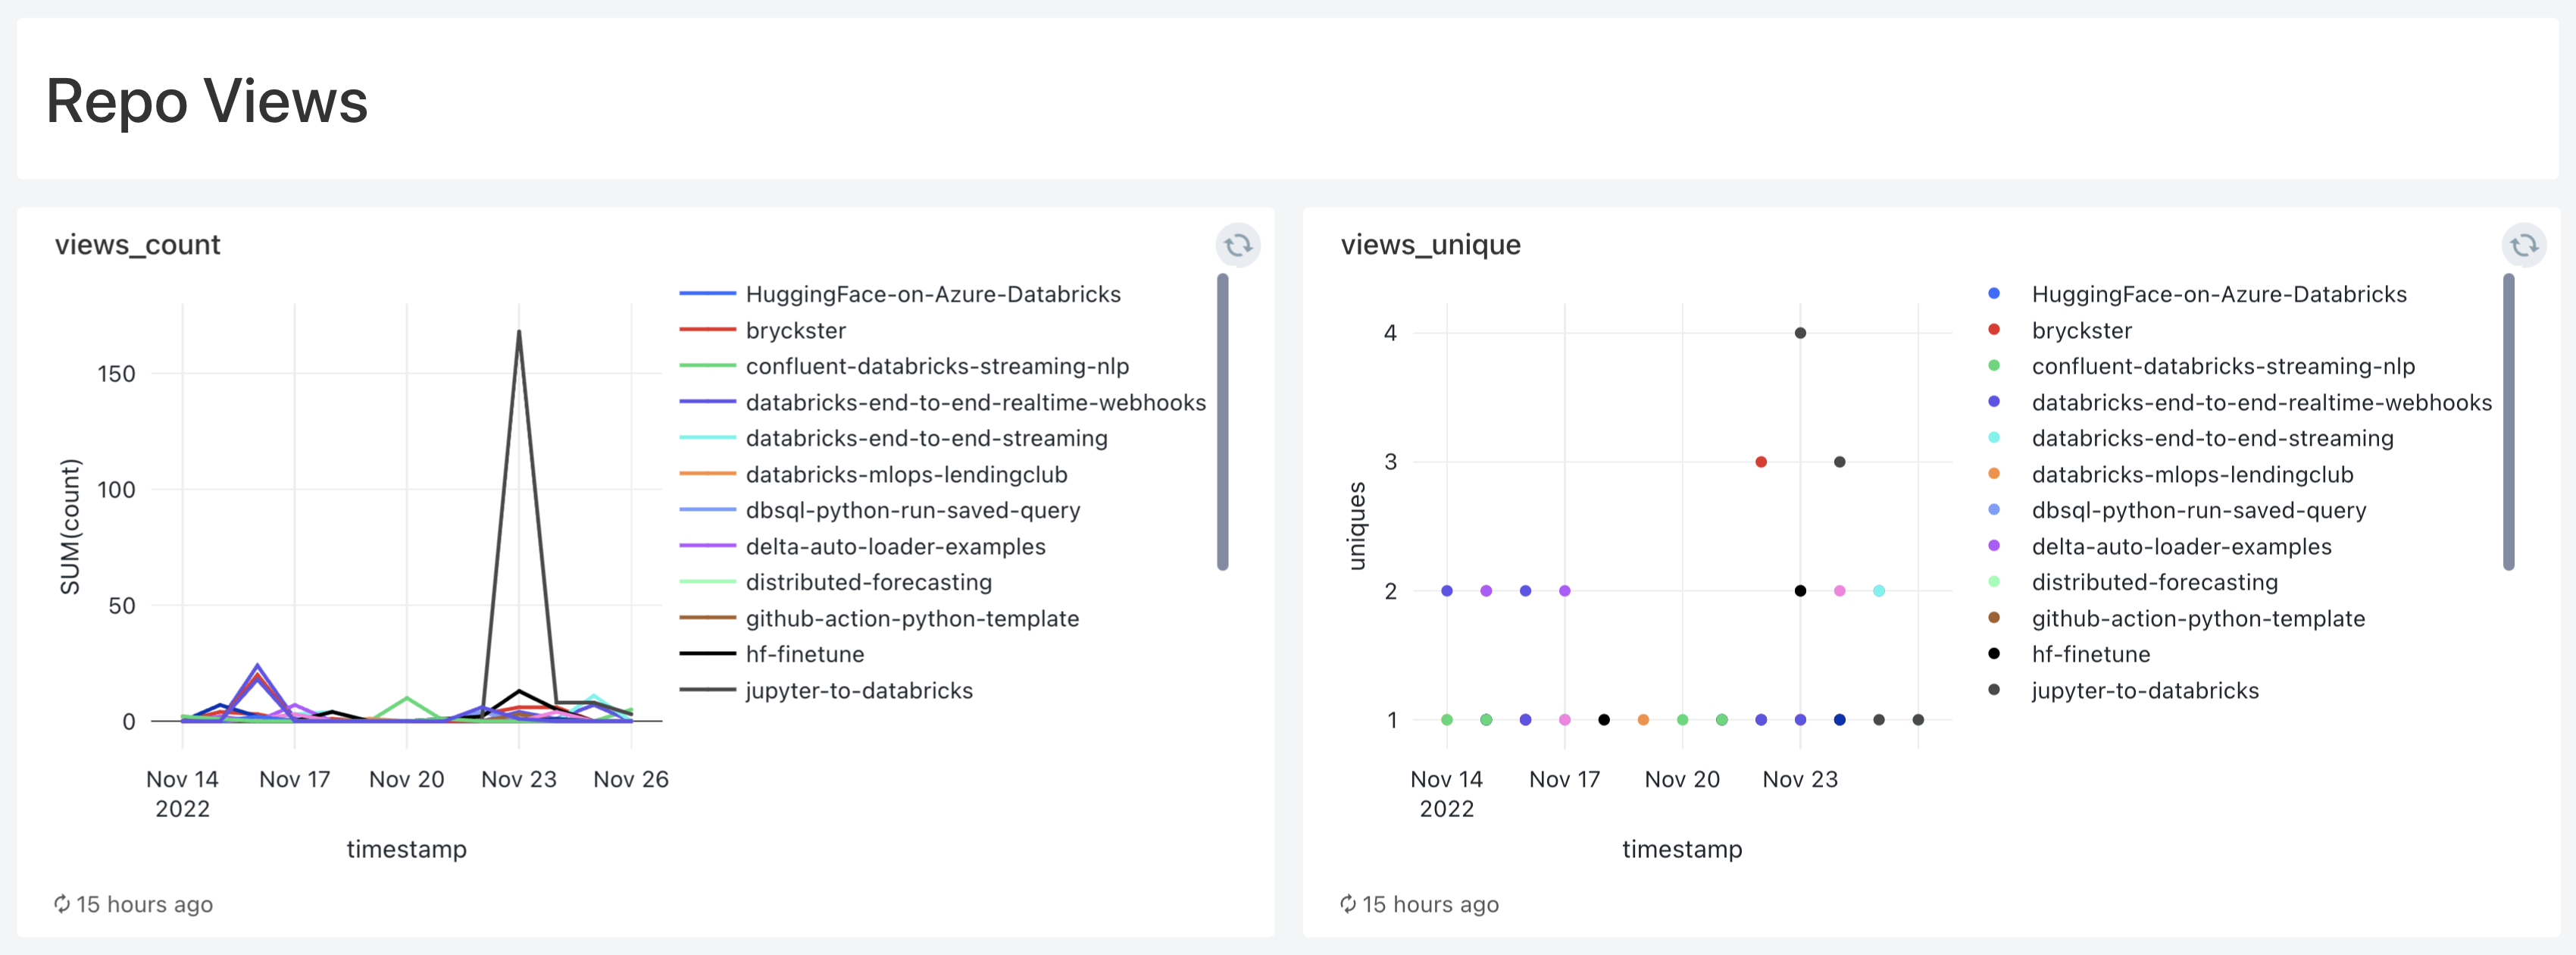
A few queries and visualizations later, and here we are:
Takeaways
Now I can store all traffic metrics from all my repos for life 🙌🏻