
A Journey Into Machine Learning Observability with Prometheus and Grafana, Part I
16 Apr 2021 ### The Case for Observability
Google’s DevOps Research and Assessment (DORA) research states that a good enough monitoring and observability solution highly contributes to continuous delivery. Thus, it is natural that observability is a hot word today, specially in software engineering. It is within the interest of organisations developing software systems to continuously deliver value to end users.
When we talk about machine learning systems, it is not different. Evaluating the metrics of a Machine Learning system is obviously a critical task during research & development phase. However, once a machine learning model is deployed in production, it is also critical to know how this model is performing. Having good instrumentation and observability practices is needed, so that we can answer this question.
“Performing” in this case can mean different things — availability, quality and other aspects. Concretely, there are multiple possible metrics involved when trying to answer this question.
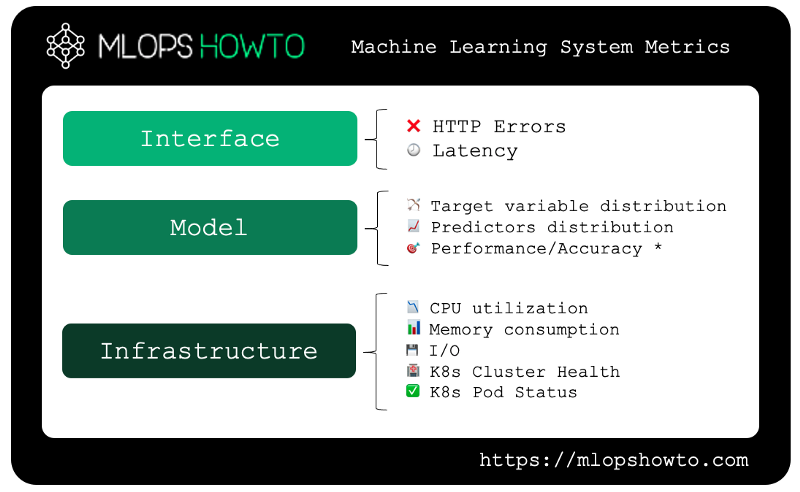 In the picture above, we can see the three main groups of metrics that we are interested when running a realtime Machine Learning system in production. Starting from the base and going through until the top of the pyramid, we have the following:
- Interface metrics: are our REST or GRPC API endpoints for our model available? If so, is the round-trip latency — the time between request and response — within acceptable boundaries?
- Model metrics: Has the statistical distribution of predicted values changed? Has the statistical distribution of our predictor variables changed? Does our model still have acceptable accuracy/error metrics?
- Infrastructure Metrics: Do we have enough compute resources (CPU/Memory)? Is our Kubernetes cluster healthy? Are our Pods available?
To gain some insights over these topics, we need to add some proper instrumentation to our setup. The good news are that in the Cloud Native world, there are well established tools to achieve that, namely Prometheus and Grafana.
In a nutshell, Prometheus is a platform for monitoring application metrics, while Grafana provides a platform to visualizing and generating alerts for these metrics. By making an analogy with an airplane, we can think of Prometheus as a set of sensors — monitoring speed, altitude, fuel and cabin pressure — while Grafana is the screen with multiple gauges, bells & whistles used to visualize the metrics associated with these measures, allowing to act upon them.
Implementation wise, both tools are modular, which allows for seamlessly connecting one to the other to export and define custom metrics, creating custom dashboards, configuring alerts, among other useful functionality.
Getting Started
We will work with the following setup:
- Local Kubernetes Cluster (running on Docker) — more instructions here
- Helm (Kubernetes Package Manager) — installation instructions here
- Helm Charts for Prometheus & Grafana
Naturally, following along with other options such as kind, Minikube or an actual Kubernetes Cluster deployed in AWS, Azure or GCP is also possible.
To simplify our work, we will work with the kube-prometheus-stack Helm chart. It is a convenient way to install the full stack (Prometheus, Grafana and other dependencies) in one shot.
- Add Prometheus Helm Repo and Update Dependencies
First, we need to add a reference to the repo hosting the chart.
2. Install Kube Prometheus Stack Helm Chart
Now that our required repos have been configured and our dependencies have been updated, it’s time to install Prometheus into our cluster.
3. Check that everything is running
To check if the chart installation was successful, we can take a quick peak into the resources that are part of the monitoring namespace.
We should be able to see all the resources deployed in the monitoring namespace.
You might notice that there are some network services which are part of our installation. To access the Grafana interface, we will be interested in the prometheus-grafana one, which listens on port 80 by default. As part of the chart’s default configurations, it exposes the pod running the Grafana web interface through a ClusterIP service.
This means that to access the web interface for it, we need to do a port forward. We will listen on localhost port 3000, targeting port 80 of the network service.
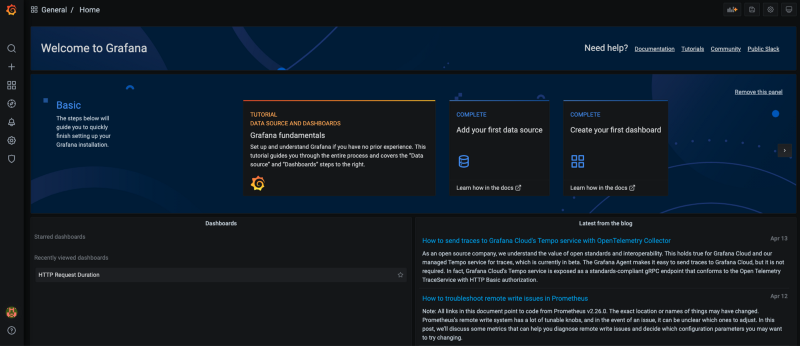
Firing up our browser and hitting http://localhost:3000 should give us the Grafana web interface. After logging in with the default credentials — admin/prom-operator, we get the following:
 ### Visualizing Default Metric Dashboards
Grafana comes with some default dashboards for monitoring a Kubernetes cluster. To visualize them, click on the “Manage” option under the Dashboards section on the left hand side menu.
For example, the Kubernetes / Compute Resources / Cluster dashboard will look like this:
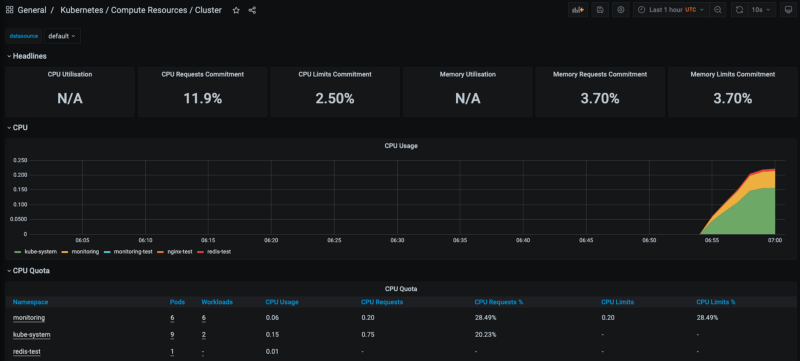 This is a pretty basic dashboard that shows some of the metrics in the Kubernetes cluster from a global perspective, considering all namespaces — CPU utilization, memory consumption, network requests, among others. If we click in any of the namespaces in the bottom, we are able to zoom into the metrics of that specific namespace.
 Feel free to explore the other dashboards. Creating your own dashboard is also possible and quite straightforward.
Takeaways
Running a Microservices architecture in Kubernetes unlocks great benefits for deploying realtime Machine Learning Systems. However, to achieve success in that involves keeping track of how our machine learning systems are performing — not only in terms of accuracy metrics, but also in terms of availability, infrastructure, and so on.
In this context, it is clear that the Prometheus stack allows us to get a glimpse over the health of our machine learning systems from an infrastructure standpoint.
The great thing about this stack is that is is highly customisable: one can deploy different types of Prometheus metrics exporters across different Kubernetes namespaces, deployments and Pods. The same goes for Grafana — you can create your own dashboards, KPIs and alerts.
This is quite useful when we want to create more sophisticated monitoring mechanisms — such as interface and model metrics monitoring.
In our next post, we will continue exploring these capabilities.
In the meantime, you might want to check out:
Keeping Your Machine Learning Models on the Right Track: Getting Started with MLflow, Part 1
Learn why Model Tracking and MLflow are critical for a successful machine learning projectmlopshowto.comKeeping Your Machine Learning Models on the Right Track: Getting Started with MLflow, Part 2
Learn how to use MLflow Model Registry to track, register and deploy Machine Learning Models effectively.mlopshowto.comWhat is Model Drift, and How it Can Negatively Affect Your Machine Learning Investment
In the domains of software engineering and mission critical systems, we cannot say that monitoring and instrumentation…mlopshowto.comm