
An Intro to Data Science for Credit Risk Modelling
08 Jul 2018 The aftermath of the 2008 subprime mortgage crisis has been terrible for many, but it created growth opportunities for new players in the retail credit field.
Following the credit scarcity that took place briefly during those times, some new internet companies have thrived, with a new business model that would become known as Peer-to-Peer Lending — or simply P2P Lending.
From its inception in the end of the last decade until now, amounts lent through P2P Lending marketplaces have grown impressively. According to PwC, U.S. peer-to-peer lending platforms’ origination volumes have grown an average of 84% per quarter since 2007.
Using Data Science, Exploratory Data Analysis, Machine Learning and public data from Lending Club, a popular P2P Lending marketplace, we will investigate this scenario further. Throughout a series of posts, we will cover the following dimensions:
- Loan Variables such as loan amount, term, interest rate, delinquency
- Borrower Profile Variables such as employment status, relationship status
- Miscellaneous Variables and other factors such as macroeconomic, geographic
Questions to be Answered
Our objective will be to analyze this data in order to answer to the questions below:
- How does the loan data distribution look like? Using Data Science, we will paint a picture detailing the most important aspects related to the loans and perform EDA (Exploratory Data Analysis).
- Are the loan grades from LC optimal? Loan grades are critical for P2P Marketplaces, as they measure the probability of a client going incurring into default, thus being crucial for businesses’ profitability.
- Can we create a better, optimized model to predict credit risk using machine learning, and beat the FICO Score? We will try to beat the loan grades assigned by LC, by creating a new machine learning model from scratch.
Lending Club Data: An Outlook
 Lending Club was one of the first companies to create an online marketplace for P2P Lending back in 2006.
It gained substantial traction in the wake of the 2008 crisis — partly due to changes in traditional banks’ capability and willingness to lend back then.
In this post, we will use data science and exploratory data analysis to take a peek Lending Club’s loan data from 2007 to 2015, focusing on the following questions regarding this period:
- Loan Absolute Variables Distribution: How does loan value, amount funded by lender and total committed by investors distribution looks like?
- Applications Volume: How many loan applications were received?
- Defaults Volume: How many loans were defaulted?
- Average Interest Rates: What was the average interest rate?
- Loan Purpose: What were the most frequent Loan Purposes?
- Loan Grades: How worthy are the loans?
- Delinquency Breakdown: How many loans were Charged Off?
By analyzing these aspects, we will be able to understand our data better and also get to know a bit of Lending Club’s story.
The dataset contains 887K loan applications from 2007 through 2015 and it can be downloaded from Kaggle.
Loan Absolute Variables Distribution
 In the dataset we have three absolute variables relating to the loans: loan amount, amount funded and total committed by investors.
These variables are similarly distributed, which shows that there is an adequate balance between funding and credit.
Applications Volume
Below we can see an evolution of Loan Applications that were issued YoY — year over year basis from 2007 to 2015.
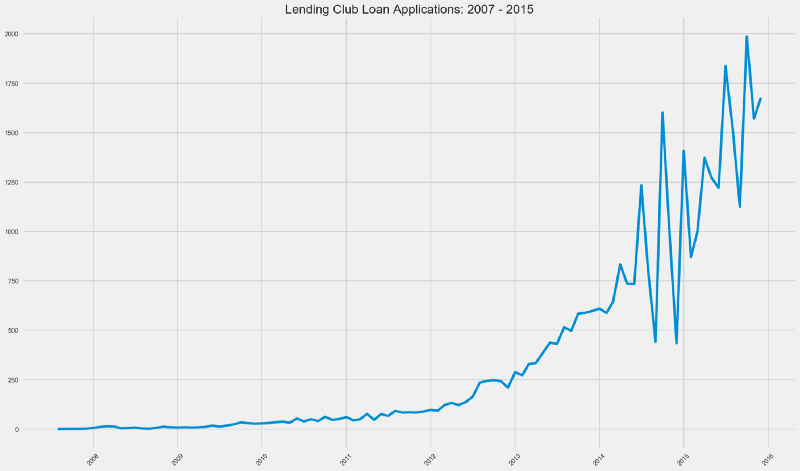 We can see that loan applications have raised steadily from mid 2007 until 2014.
There are definitely two distinct graph patterns considering pre-2014 and post-2014.
From early 2014 until mid 2014, we can see a boom in loan applications volume, only to see a violent drop after this period, with the pattern repeating itself.
What could be reasons for that?
- IPOs are the holy grail for every startup (or at least, for its investors). Lending Club went public in late 2014 — it could have been preparing for an IPO prior to this period and hence adopted more aggressive growth measures.
- Startups preparing for IPOs garner more attention from regulators and the SEC. This equals tomore strict risky capital controls, hence the sudden drops in this variable.
- In 2014, Lending Club acquired Springstone Financial for US$ 140 million in cash. To that date, Springstone Financial had financed its consumer loans with traditional bank debt (who faced more SEC and FED scrutinity than P2P Marketplaces at that time). This could have meant more stringent compliance, liquidity and credit risk controls.
Defaults Volume
How many loans were defaulted?
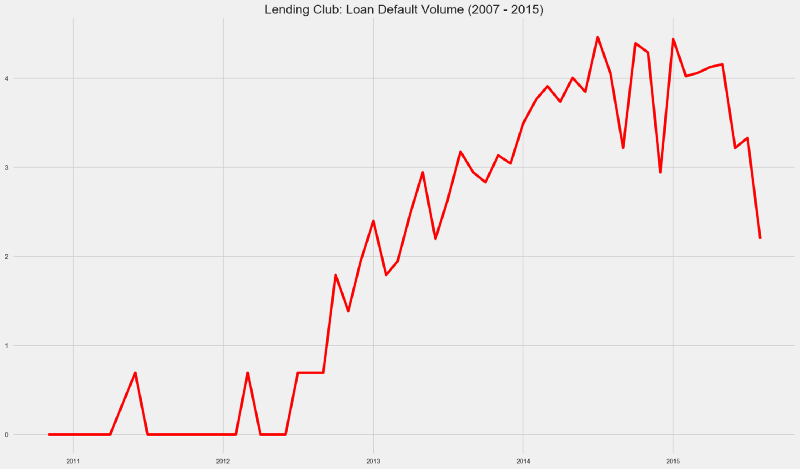 Loan defaults have seen a massive growth from 2012 until the middle of 2014. From this period until the end of 2014, the default growth pace has pretty much followed loan application volume.
By late 2015, defaulted loans volume reached 2013 levels.
In the plot below we can see a comparison between the Loan Applications and Loan Defaults in log scale.
 Take a look at the period between mid 2014 and early 2015.
As of 2015, looks like Lending Club was going through a perfect storm — loan applications were rising and loan defaults were diminishing.
Loan Purpose
What were the most frequent Loan Purposes?
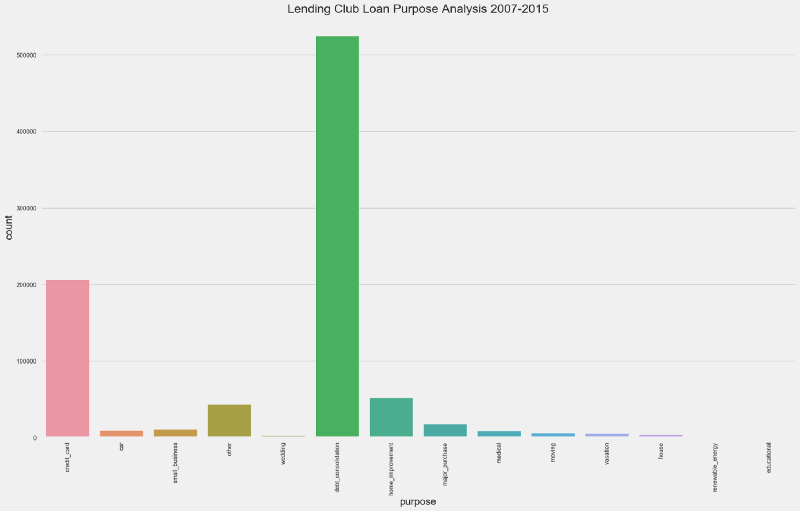 Debt Consolidation stands as clear winner for loan purpose, with more than 500K loans — or 58% from the total.
Other highlights include:
- Credit Card — more than 200K (~20%)
- Home Improvement — more than 50K (~8%)
- Other Purposes— less than 50K (~3%)
Average Interest Rates
What was Lending Club’s the average interest rate between 2007 and 2015?
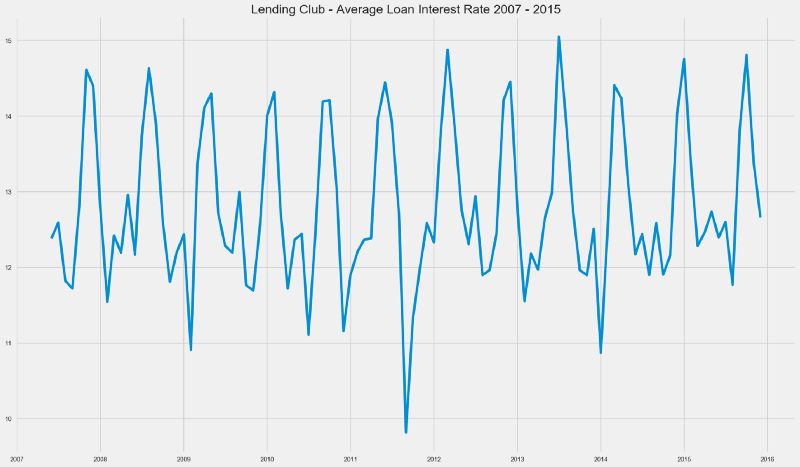 Loan Interest Rates have followed an interest pattern over these years. One could also hint at it being a Stationary Time Series.
While checking for Time Series Stationarity is beyond the scope of this initial article, it would surely be an interesting matter to revisit in the future.
Delinquent Loans
Delinquency happens when a borrower fails to pay the minimum amount for an outstanding debt.
In the countplot below we can see the amount of loans that incurred in any stage of delinquency, according to the definitions used by Lending Club.
- Charged Off — defaulted loans for which there is no expectation from the lender in recovering the debt
- Default— borrower has failed to pay his obligations for more than 120 days
- Late —borrower has failed to pay his obligations for 31 to 120 days
- Grace Period — borrower still has time to pay his obligations without being considered delinquent
- Late — payment is late by 16 to 30 days
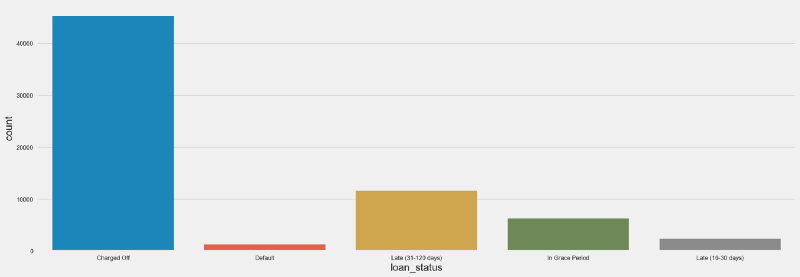 The amount of Charged Off loans seems impressive — for more than 40K loans, borrowers were not able to pay their obligations and there was no longer expectation that they would be able to do so.
In relative terms, charged off loans represented less than 5% of the total loans.
Loan Grades
Loan Grades and Subgrades are assigned by Lending Club based on the borrower’s credit worthiness and also on some variables specific to that Loan.
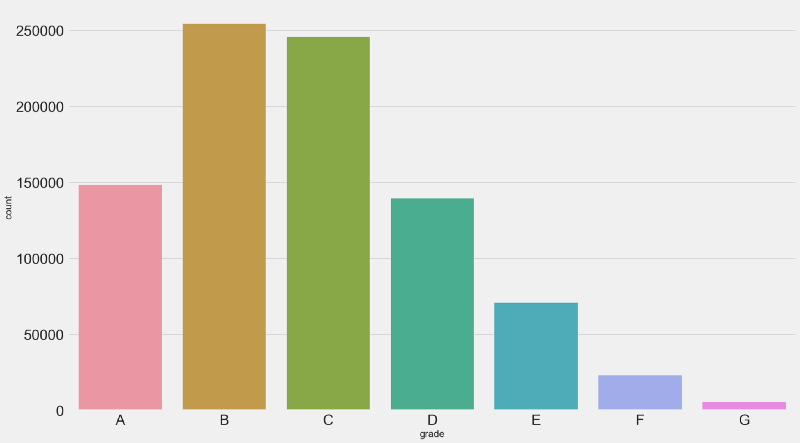 Countplot for past loan grades.The majority of loans is either graded as B or C — together these correspond to more than 50% of the loan population.
While there is a considerable amount of A graded or “prime” loans (~17%), there is a small amount of G graded, or “uncollectible” loans (~0,06%). Which is a good sign for Lending Club.
But, are these the right grades?
Let’s zoom into the loan subgrades for delinquent loans and find out.
Delinquency Breakdown
From the entire loan population, we have 67K delinquent loans (~7.5%).
Let’s zoom in a bit into the delinquent loans by analyzing their Grades and Subgrades.
 Looking at 67K delinquent loans, we have the following highlights:
- 2.5K (~4%) loans with an Grade A were charged off
- 9.5K (~14%) loans with Grade B were charged off
- 12.8K (~20%) loans with Grade C were charged off
Intuitively, we would expect grades worse than C to be the worse payers than A, B and C — something that doesn’t quite happen here. For an optimal grading system we would expect the amount of charged off loans to be in line with the amount of G Graded loans.
Maybe there’s a problem with these grades?
Let’s check the opposite side first — the good payers.
What were the grades and subgrades for loans that were fully paid?
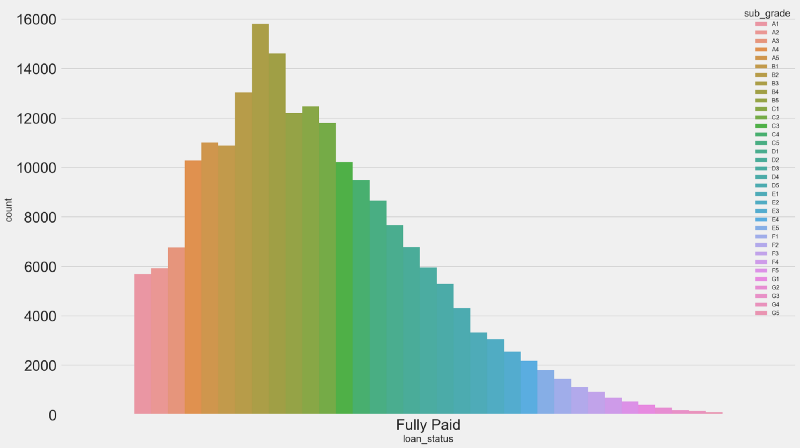 From 43K A Graded Loans:
- 2.5K were charged off (~5.8%)
- 40K were fully paid (~93%)
- 500 were either defaulted, late or in grace period (~1,16%)
This begs the question: are these loan grades optimal?
We have some indications that they are not. Are these indications enough?
We will analyze this further in the next posts.
Credit Risk Modeling is such an exciting field for applying Data Science and Machine Learning. The possibilities for optimization are endless — and we’re just getting started.
For now, I hope you enjoyed this initial analysis and be sure that there is more to come.
You Might Also Like
Keeping Your Machine Learning Models on the Right Track: Getting Started with MLflow, Part 2
Learn how to use MLflow Model Registry to track, register and deploy Machine Learning Models effectively.mlopshowto.comAbout MLOps And Why Most Machine Learning Projects Fail — Part 1
If you have been involved with Machine Learning (or you are aiming to be), you might be aware that reaping the…mlopshowto.com